
We are often asked what sets Bonnefield apart as a leading Canadian farmland manager. While there are many qualities that come to mind (our strong 10+ year track record, institutional quality reporting and administration, and our sale-leaseback model that attracts leading farm partners, just to name a few), diversification is one of the most obvious.
Geographic diversification has been a central theme in Bonnefield’s investment thesis since the firm’s inception over a decade ago. As Canada’s leading farmland investment manager, we invest in more Canadian provinces than any other Canadian agriculture-focused asset manager. We apply a granular approach to diversification, investing in over 30 unique growing regions across the country, and ensuring portfolio diversification across multiple climatic regions, crop types and tenant relationships.
Assessing Risk & Return: Sharpe Ratio Analysis
To illustrate the value of diversification in an investment portfolio, we conducted a Sharpe ratio analysis(1) using historical Canadian farmland values between 1985-2019. This type of analysis is a staple of portfolio management theory and a relative measure of the trade-off between risk and return. A higher Sharpe ratio typically suggests a higher potential return per unit of risk taken on and therefore, many investors focus on improving / maximizing the Sharpe ratio of their portfolios.
Risk-Return Profile: Diversified Canadian Farmland in a Portfolio (Sharpe Ratio Analysis)(2)
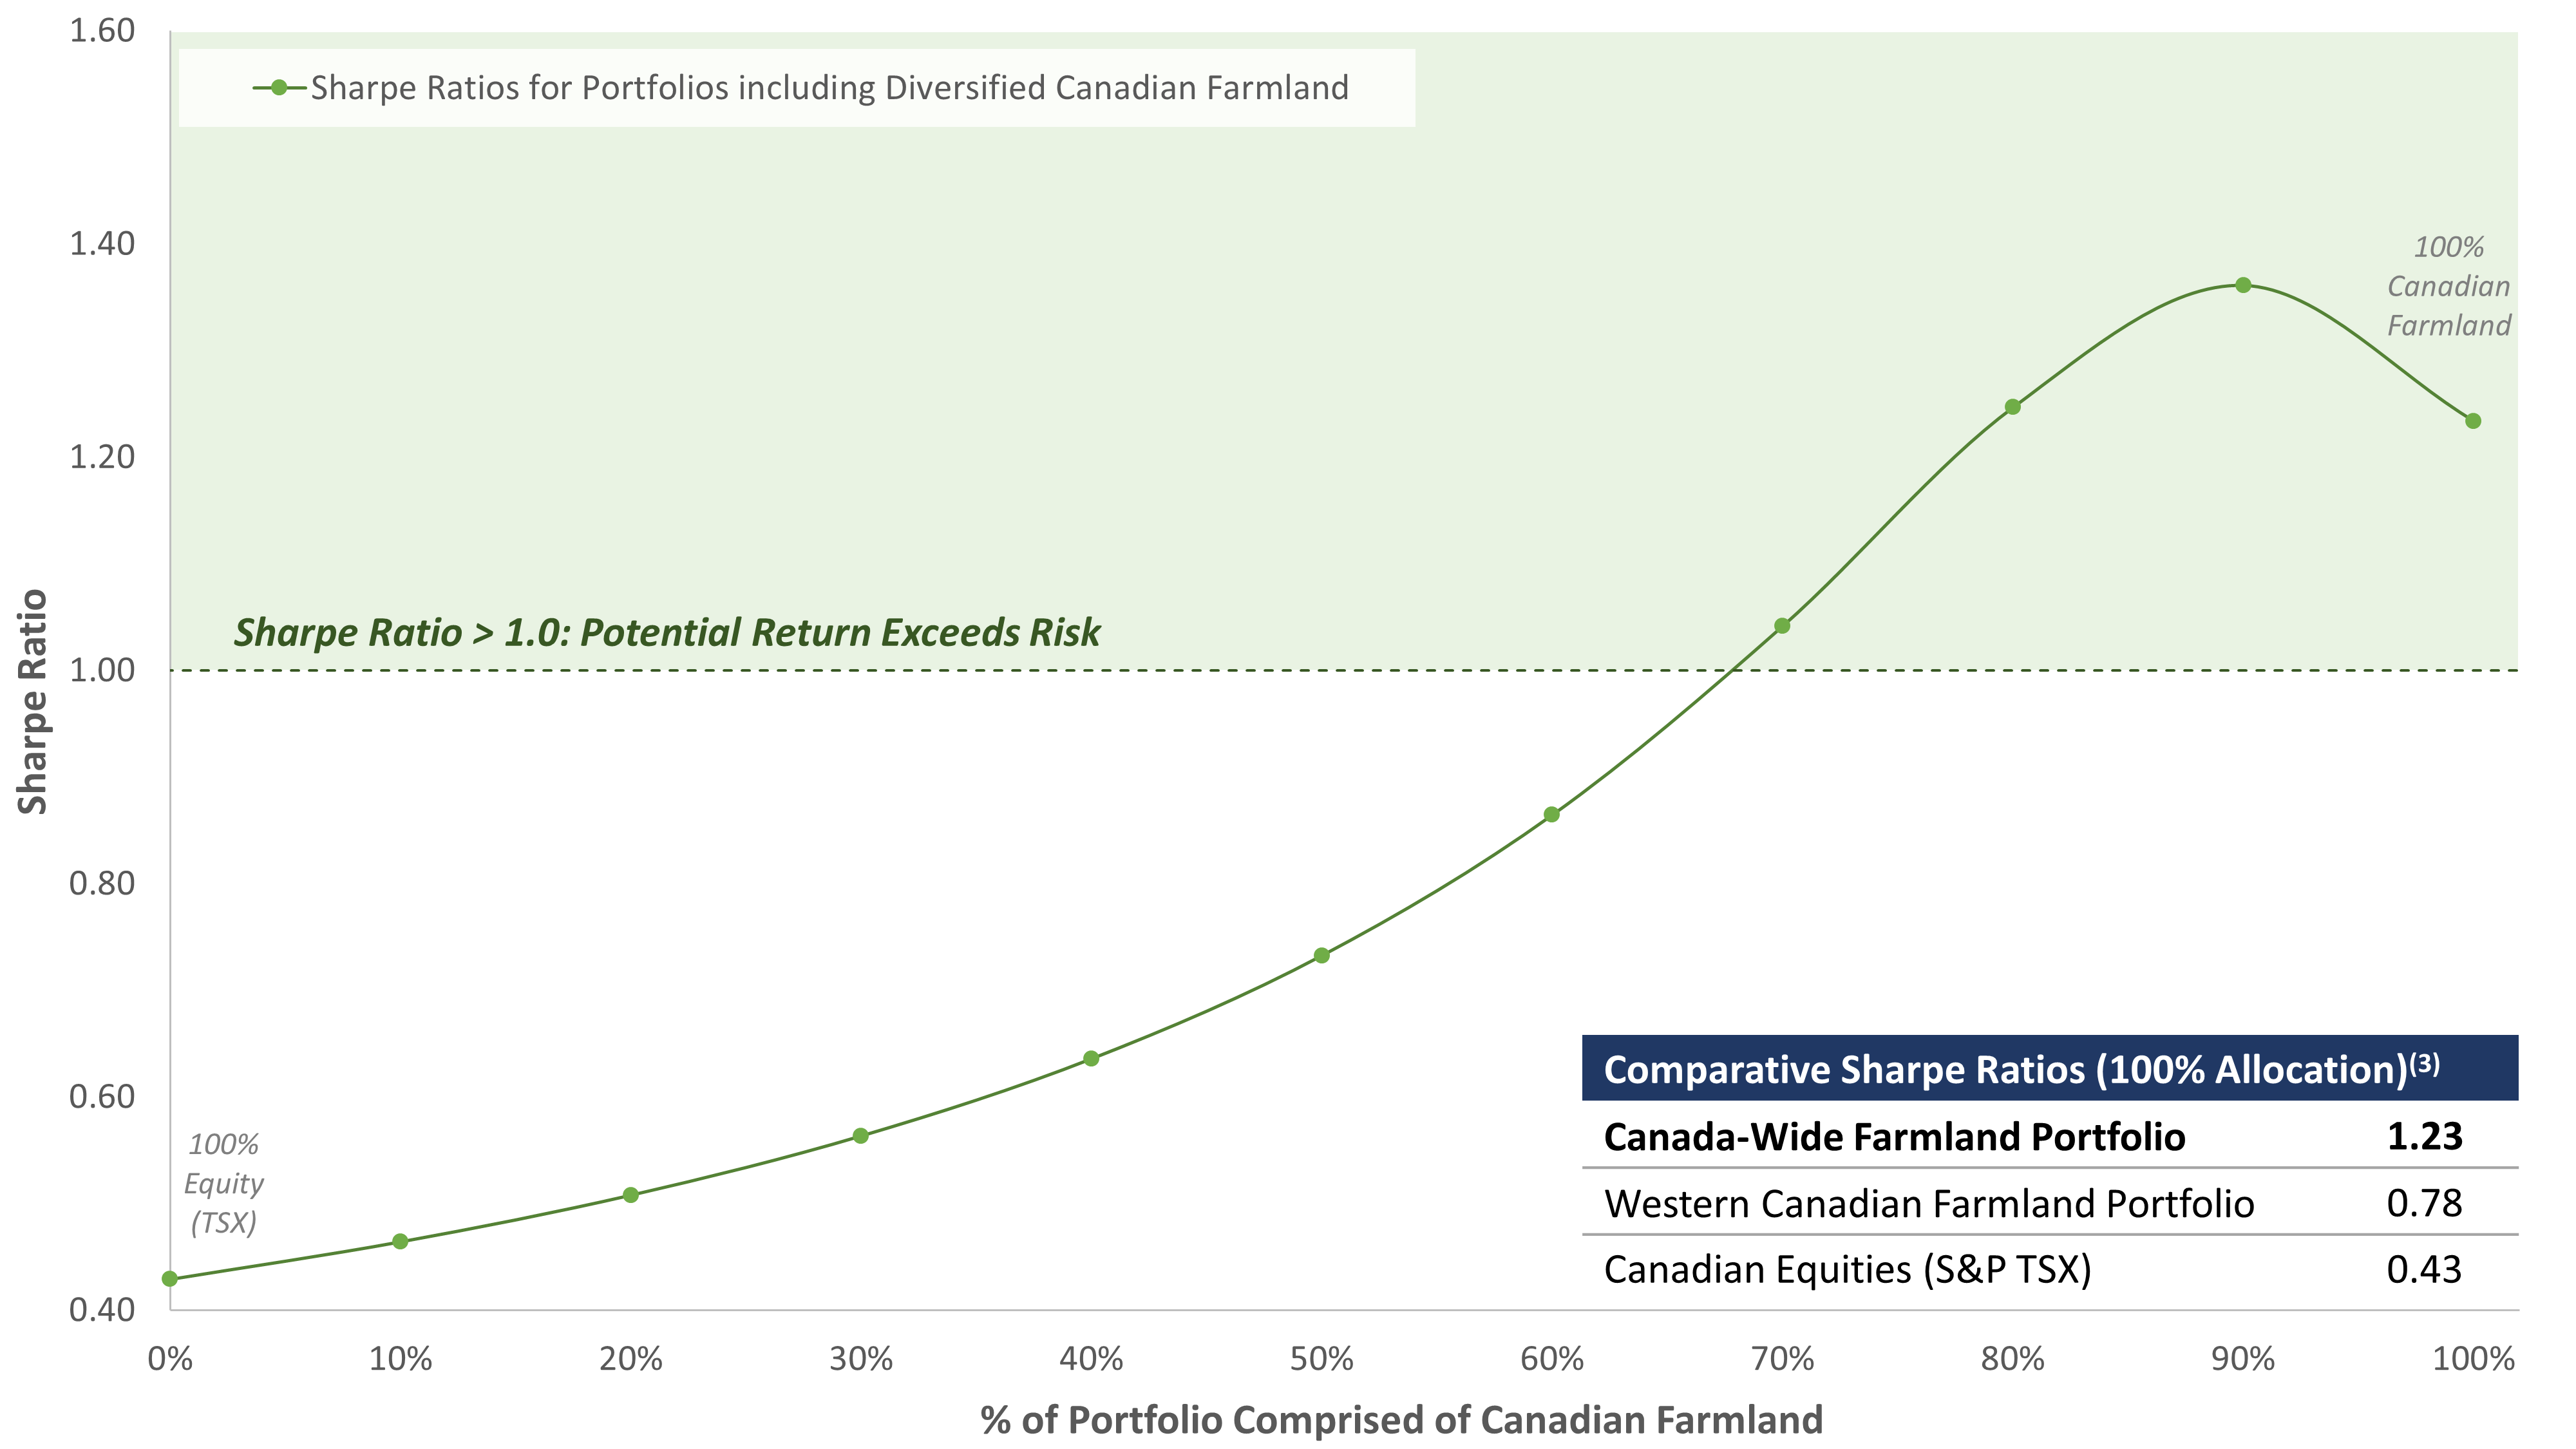
The first takeaway from this analysis is the positive impact on the Sharpe Ratio as a result of increasing the allocation to Canadian farmland (regardless of its diversification) as opposed to holding only publicly traded equity. With its historically stable return profile, Canadian farmland reduces the volatility of returns and, therefore, improves the Sharpe ratio.
The second takeaway is the relative benefit of holding a portfolio with greater diversification amongst its farmland holdings. As seen in the chart above, portfolios consisting of farmland diversified across most provinces in Canada (Bonnefield currently invests in BC, AB, SK, MB, ON, NB, and NS) demonstrate higher Sharpe ratios, indicative of a favourable risk‐return trade-off, compared to those with farmland limited to only the prairie provinces. This illustrates the relative benefits of maximizing potential diversification within the farmland portfolio.
As noted in our Q1 2020 Newsletter, the Canadian agricultural community has been optimistic since the beginning of 2021 given:
- The backdrop of increased feed demand from China;
- The reduced crop supply from Brazil and Argentina; and
- The Russian export tax on wheat.
Combined with a prolonged period of low interest rates, relatively low transactional activity for Canadian farmland in 2020, and the current multi-year high commodity prices for key crops, we continue to believe that Canadian farmland values are poised for an exciting period of strong growth.
As investors explore the benefits of Canadian farmland within their investment portfolios, we encourage them to consider the relative value of exposure to a well-diversified farmland portfolio to minimize volatility and maximize your potential risk-adjusted returns.
About Bonnefield Financial
Bonnefield is the foremost provider of land-lease financing for farmers in Canada. Bonnefield is dedicated to preserving farmland for farming, and the firm partners with growth-oriented farmers to provide farmland leasing solutions to help them grow, reduce debt, and finance retirement and succession. The firm’s investors are individuals and institutional investors who are committed to the long term future of Canadian agriculture. www.bonnefield.com
Source: Farm Credit Canada, Statistics Canada, Yahoo Finance
(1) Sharpe ratios represent a relative measure potential returns compared to potential risk of an investment, and are calculated by dividing i) the excess return above a selected risk-free rate (i.e., average historical rate of return for an asset/investment less a risk-free rate such as the prevailing rate for a Government or Treasury-issued instrument) by ii) the standard deviation of those historical returns.
(2) Analysis contemplates hypothetical portfolios balanced between i) Canadian equities (S&P TSX index) and ii) Statistics Canada farmland values (weighted equally between selected provinces; Bonnefield’s investment provinces include BC, AB, SK, MB, ON, NS, and NB), between 1985 and 2019.
(3) Noted Sharpe ratios assume 100% allocation of a hypothetical portfolio to each of i) Canadian farmland in Bonnefield’s investment provinces, ii) Canadian farmland in AB/SK/MB only, and iii) Canadian equities (S&P TSX index).